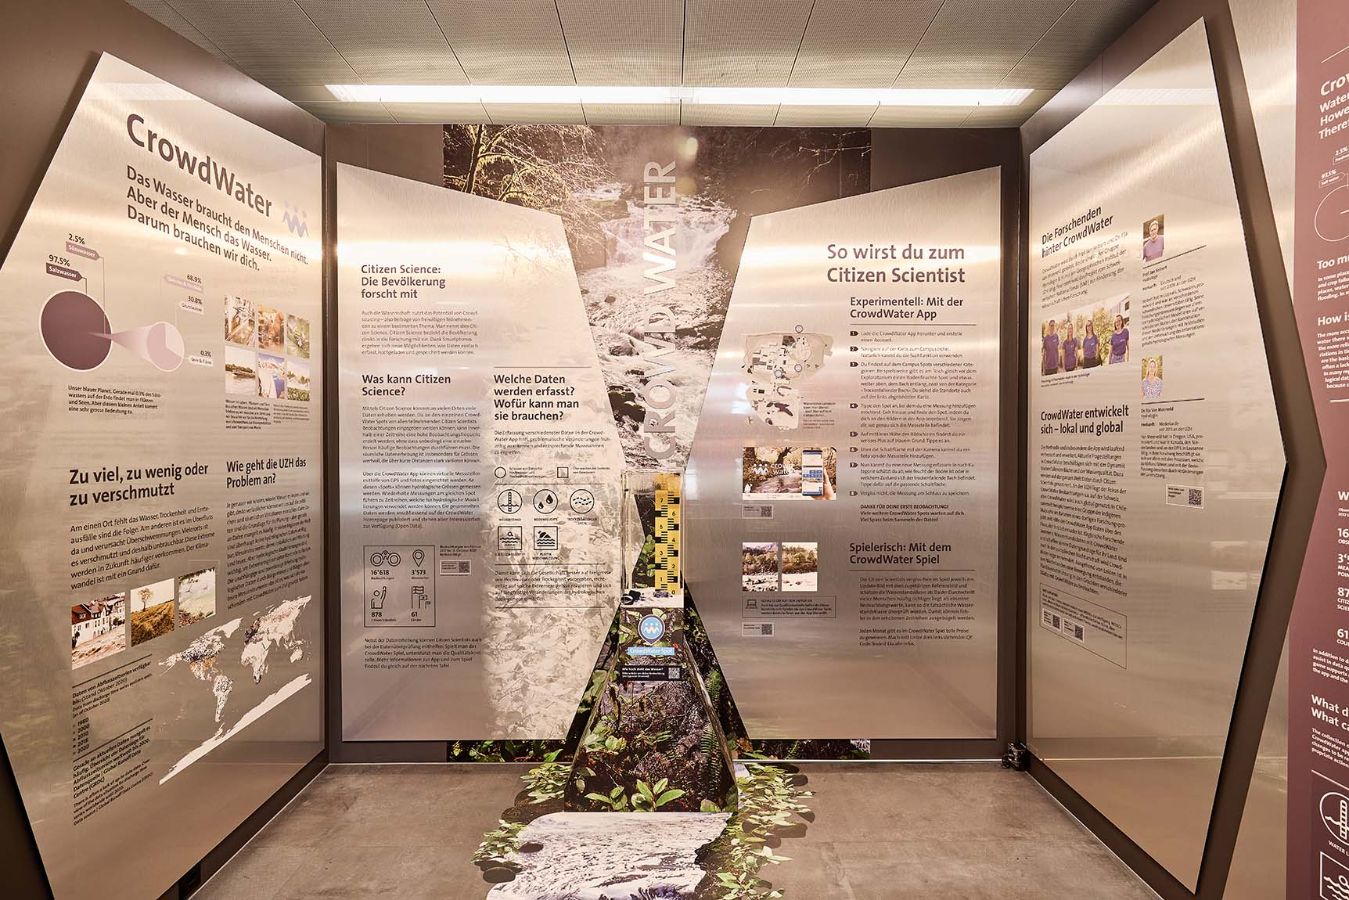
CrowdWater Project
Can we predict disasters such as drought, crop failures or floods? What data and technologies are needed and how can you help researchers?
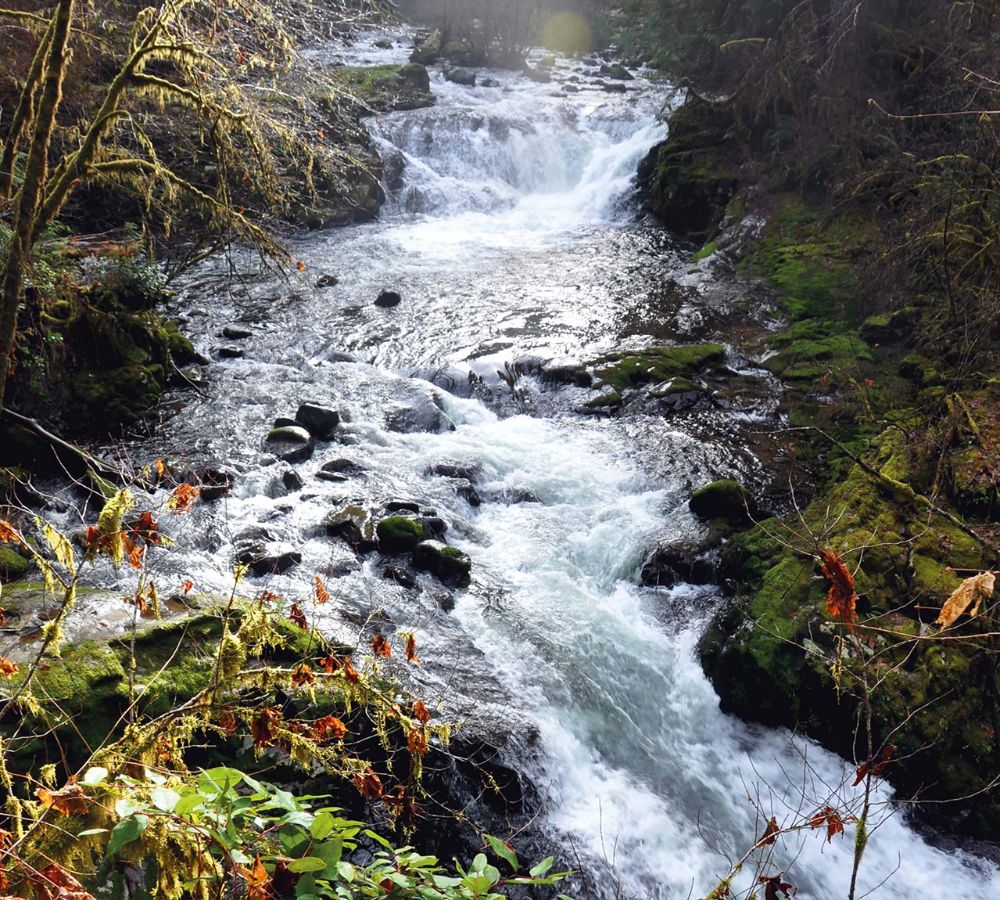
The question of predicting periods of drought and flooding is becoming increasingly important in light of global warming and its consequences. This prediction is the focus of the CrowdWater project. As water levels are constantly changing - visibly on riverbanks, and observably in soil moisture - research needs as many attentive eyes as possible. Find out here how to become involved and what role you and your smartphone can play.
Water does not need humans.
However, humans need water.
Therefore we need you.
Table of contents
Introduction
Water distribution

Our blue planet. Only 0.3% of the freshwater on Earth is found in rivers and lakes, but this small percentage is very significant.
Water is life

Plants and animals need water. We humans drink it, we wash ourselves with it, we need it for the production of food, the production of electricity and the transportation of goods.
Too much, too little or too contaminated
In some places, there is no water. Drought and crop failures are the results. In other places, water is in abundance and causes flooding. In many places, the water is contaminated and, therefore, useless. These extremes will occur more frequently in the future. Climate change is one of the reasons for this.

How is the UZH tackling the problem?
The more accurately we know how much water there will be, where and when, the more reliably we can adapt to the variations in time and place. Good data are the basis for planning – but there is often a lack of data. In many regions of the world, no hydrological data is available at all, largely because of the expense of measuring instruments, their installation and their maintenance. However, hydrological modelling is important to keep extreme events under control. The independent and reliable collection of hydrological data by citizens without expensive measuring instruments is the goal of the researchers at CrowdWater.

Citizen Science
The public engages in research
Science also utilises the potential of crowdsourcing – i.e. contributions from volunteers on a specific topic. This is called citizen science. Citizen science involves the public directly in research. Thanks to smartphones, new possibilities are opening up for accessible data collection, uploading and storage.
What can citizen science do?
Citizen science can be used to collect a lot of different types of data in many places. Since observations can be entered at each CrowdWater spot by all participating citizen scientists, a high frequency of observations can be achieved within a time series without a single individual having to make frequent observations. Spatial data collection is incredibly valuable for quantities that can vary significantly over short distances.
With the CrowdWater app, virtual measuring points can be set up using GPS and photos. At these „spots“ hydrological parameters can be collected. Repeated measurements at the same spot will result in time series which can be used for hydrological modelling. The collected data are then published on the CrowdWater homepage and are available to all interested parties (Open Data).
-

- Zoom
- Citizen scientist observations from 2017 to 2020. QR–Code: www.spotteron.com/crowdwater
Data status as of 03.03.2026
- All contributions: 65'719
- All countries: 89
- Individual sites: 11'517
In addition to data collection, citizen scientists can also assist in data quality control: Playing the CrowdWater game supports quality control. More information about the app and the game can be found bellow under CrowdWater App.
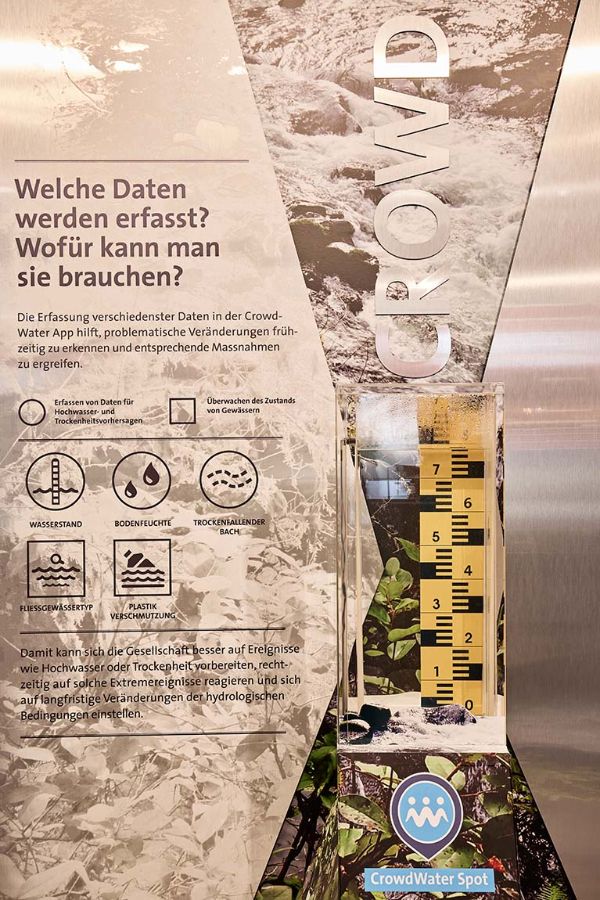
What data is collected? What can it be used for?
The collection of various data in the CrowdWater app helps problematic changes to be recognised early and appropriate actions to be taken.

This enables society to better prepare for events such as floods or droughts, to react in time to such extreme events and to adapt to long-term changes in hydrological conditions.
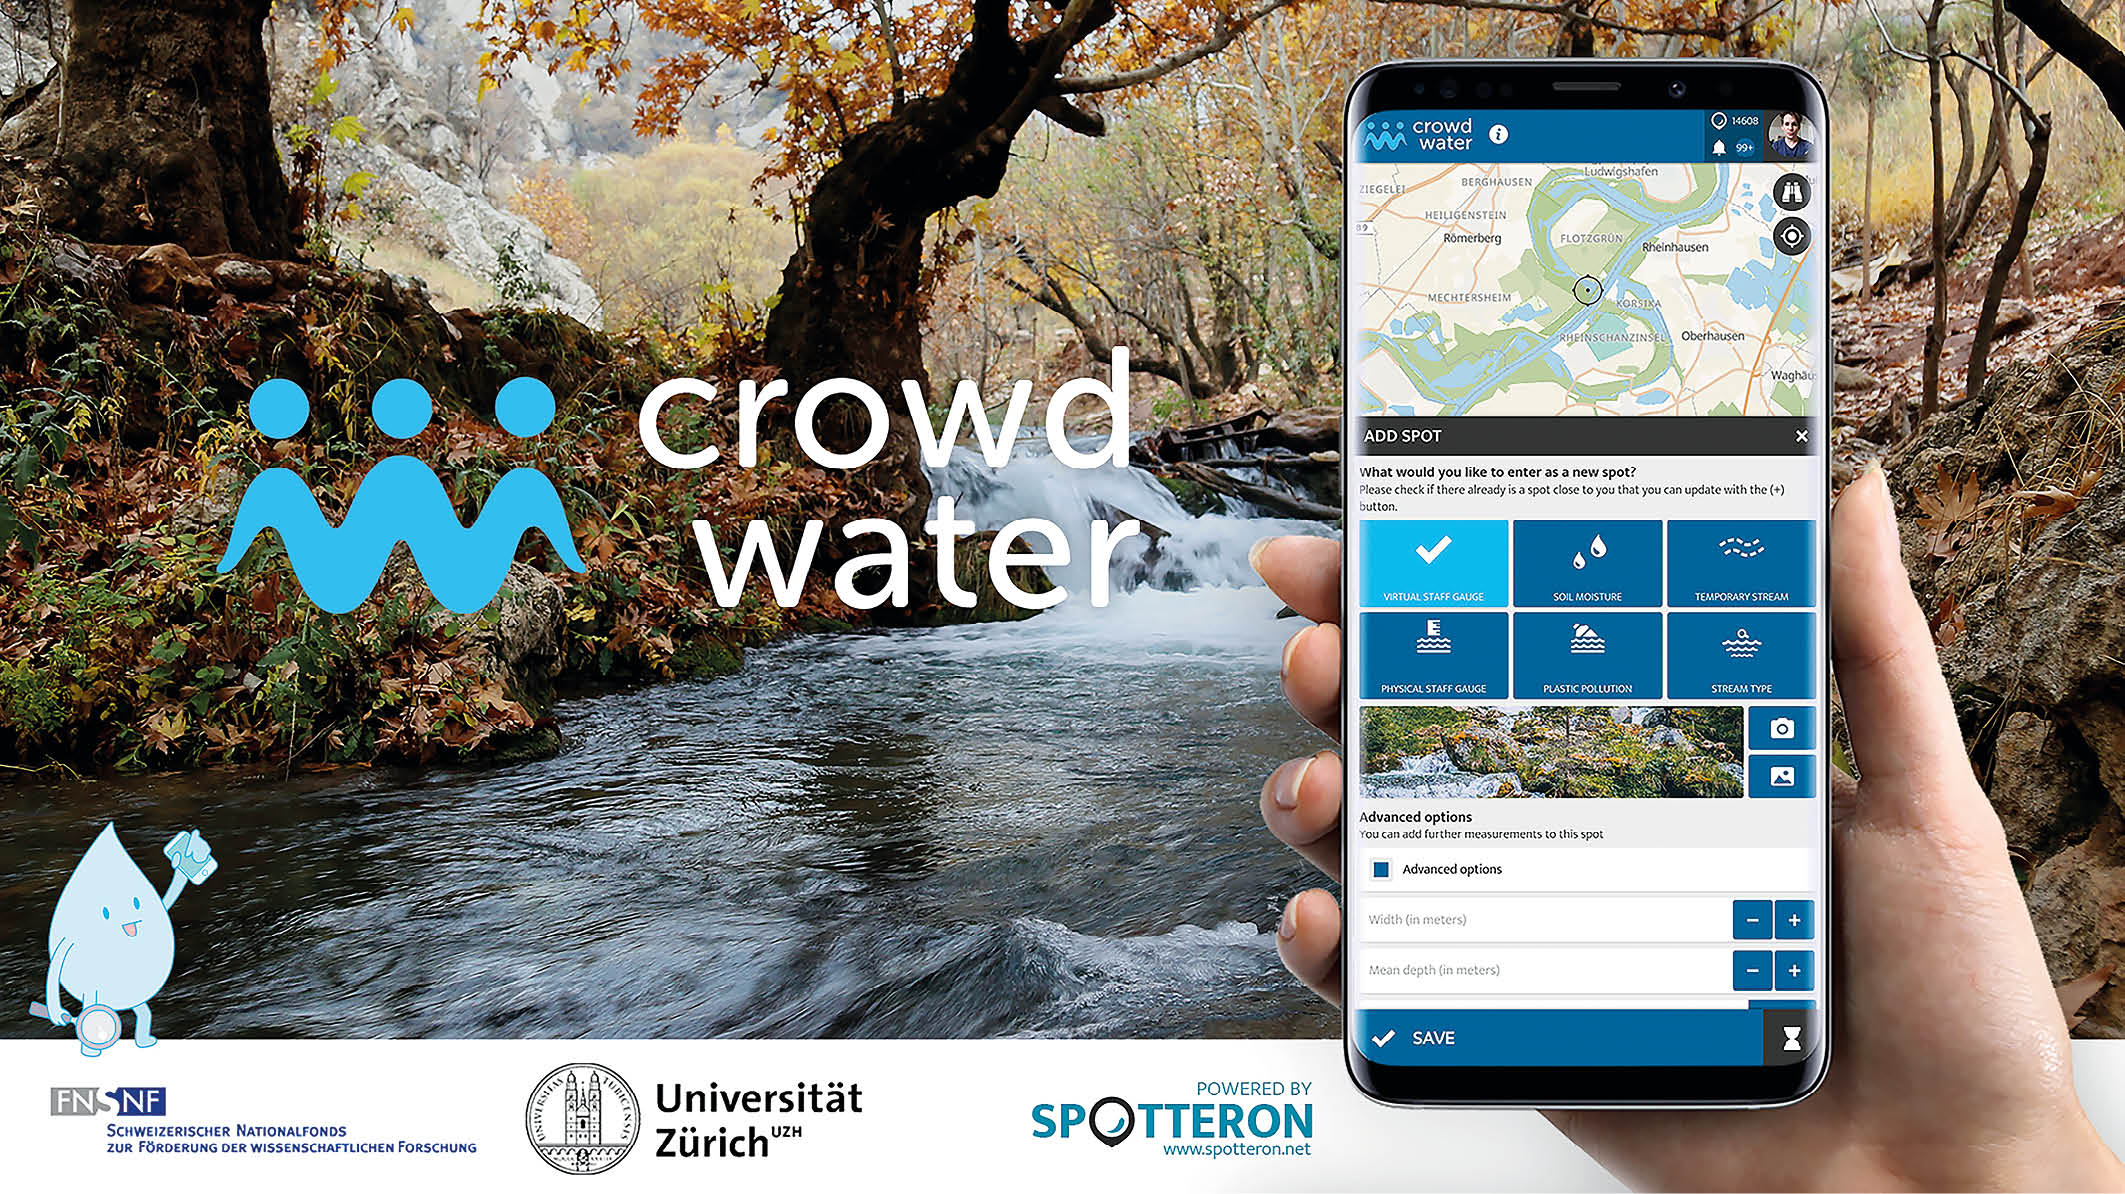
CrowdWater App
Become a Citizen Scientist with the CrowdWater App
-

- Zoom
- QR-Code: crowdwater.ch/en/crowdwaterapp-en/
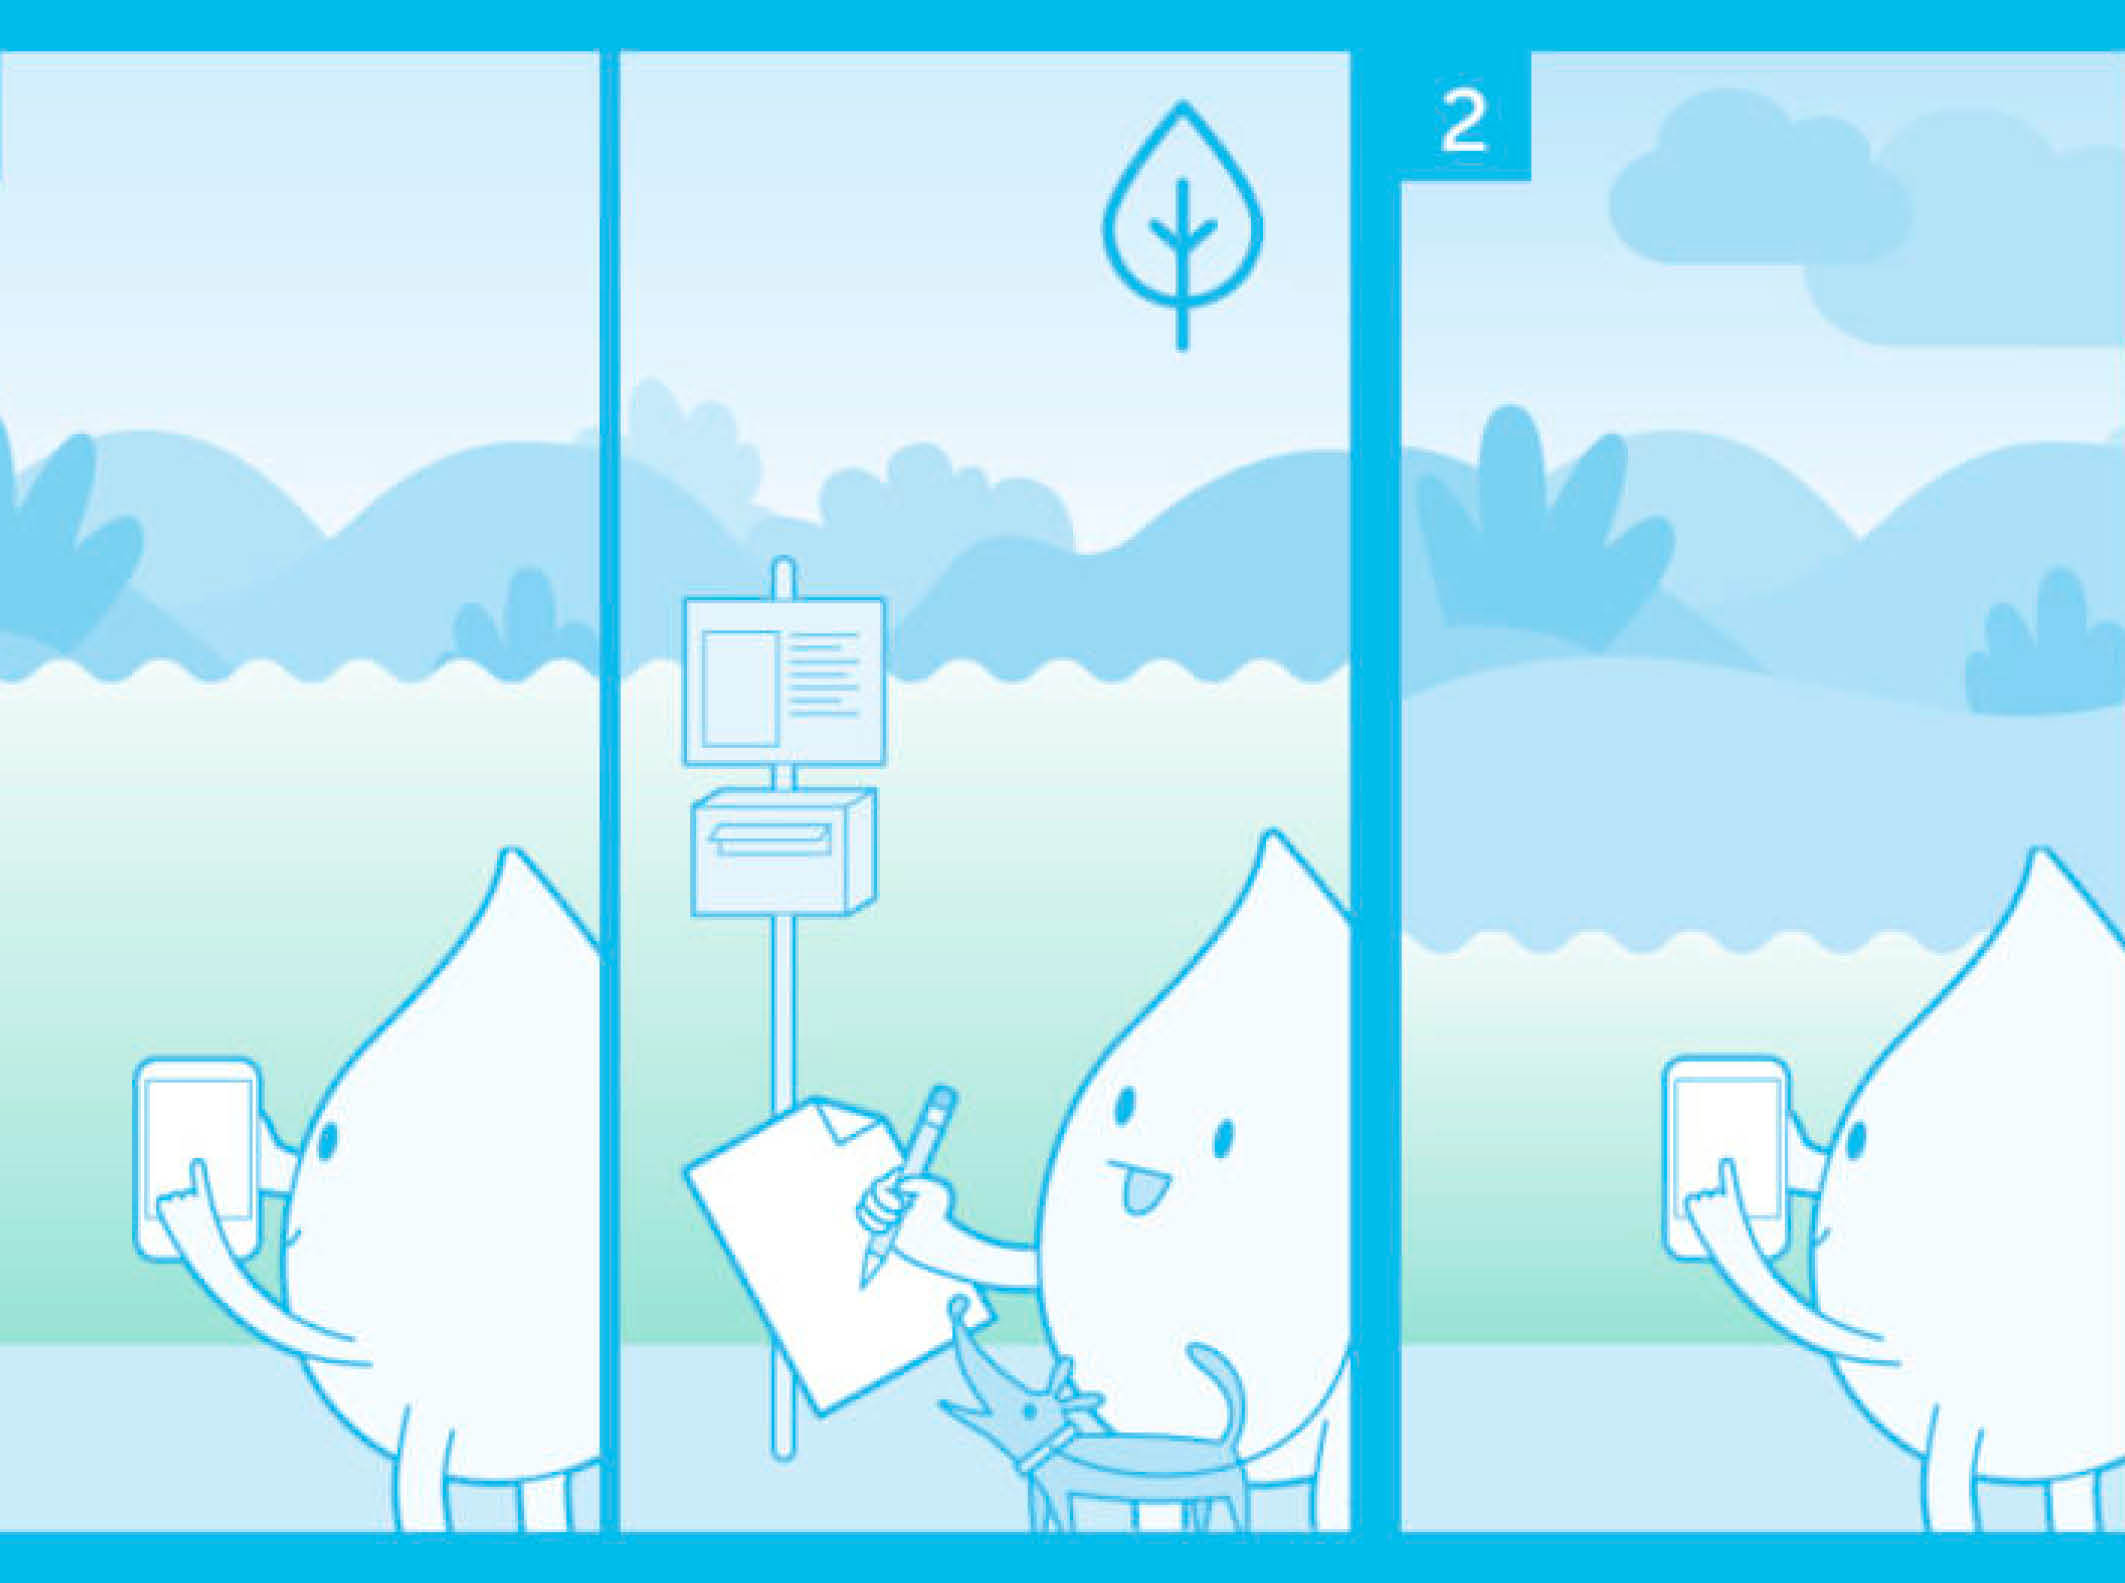
Experimental: With the CrowdWater app
- Download the CrowdWater app and create an account.
- Navigate on the map to Campus Irchel. You can, of course, use the search function.
-
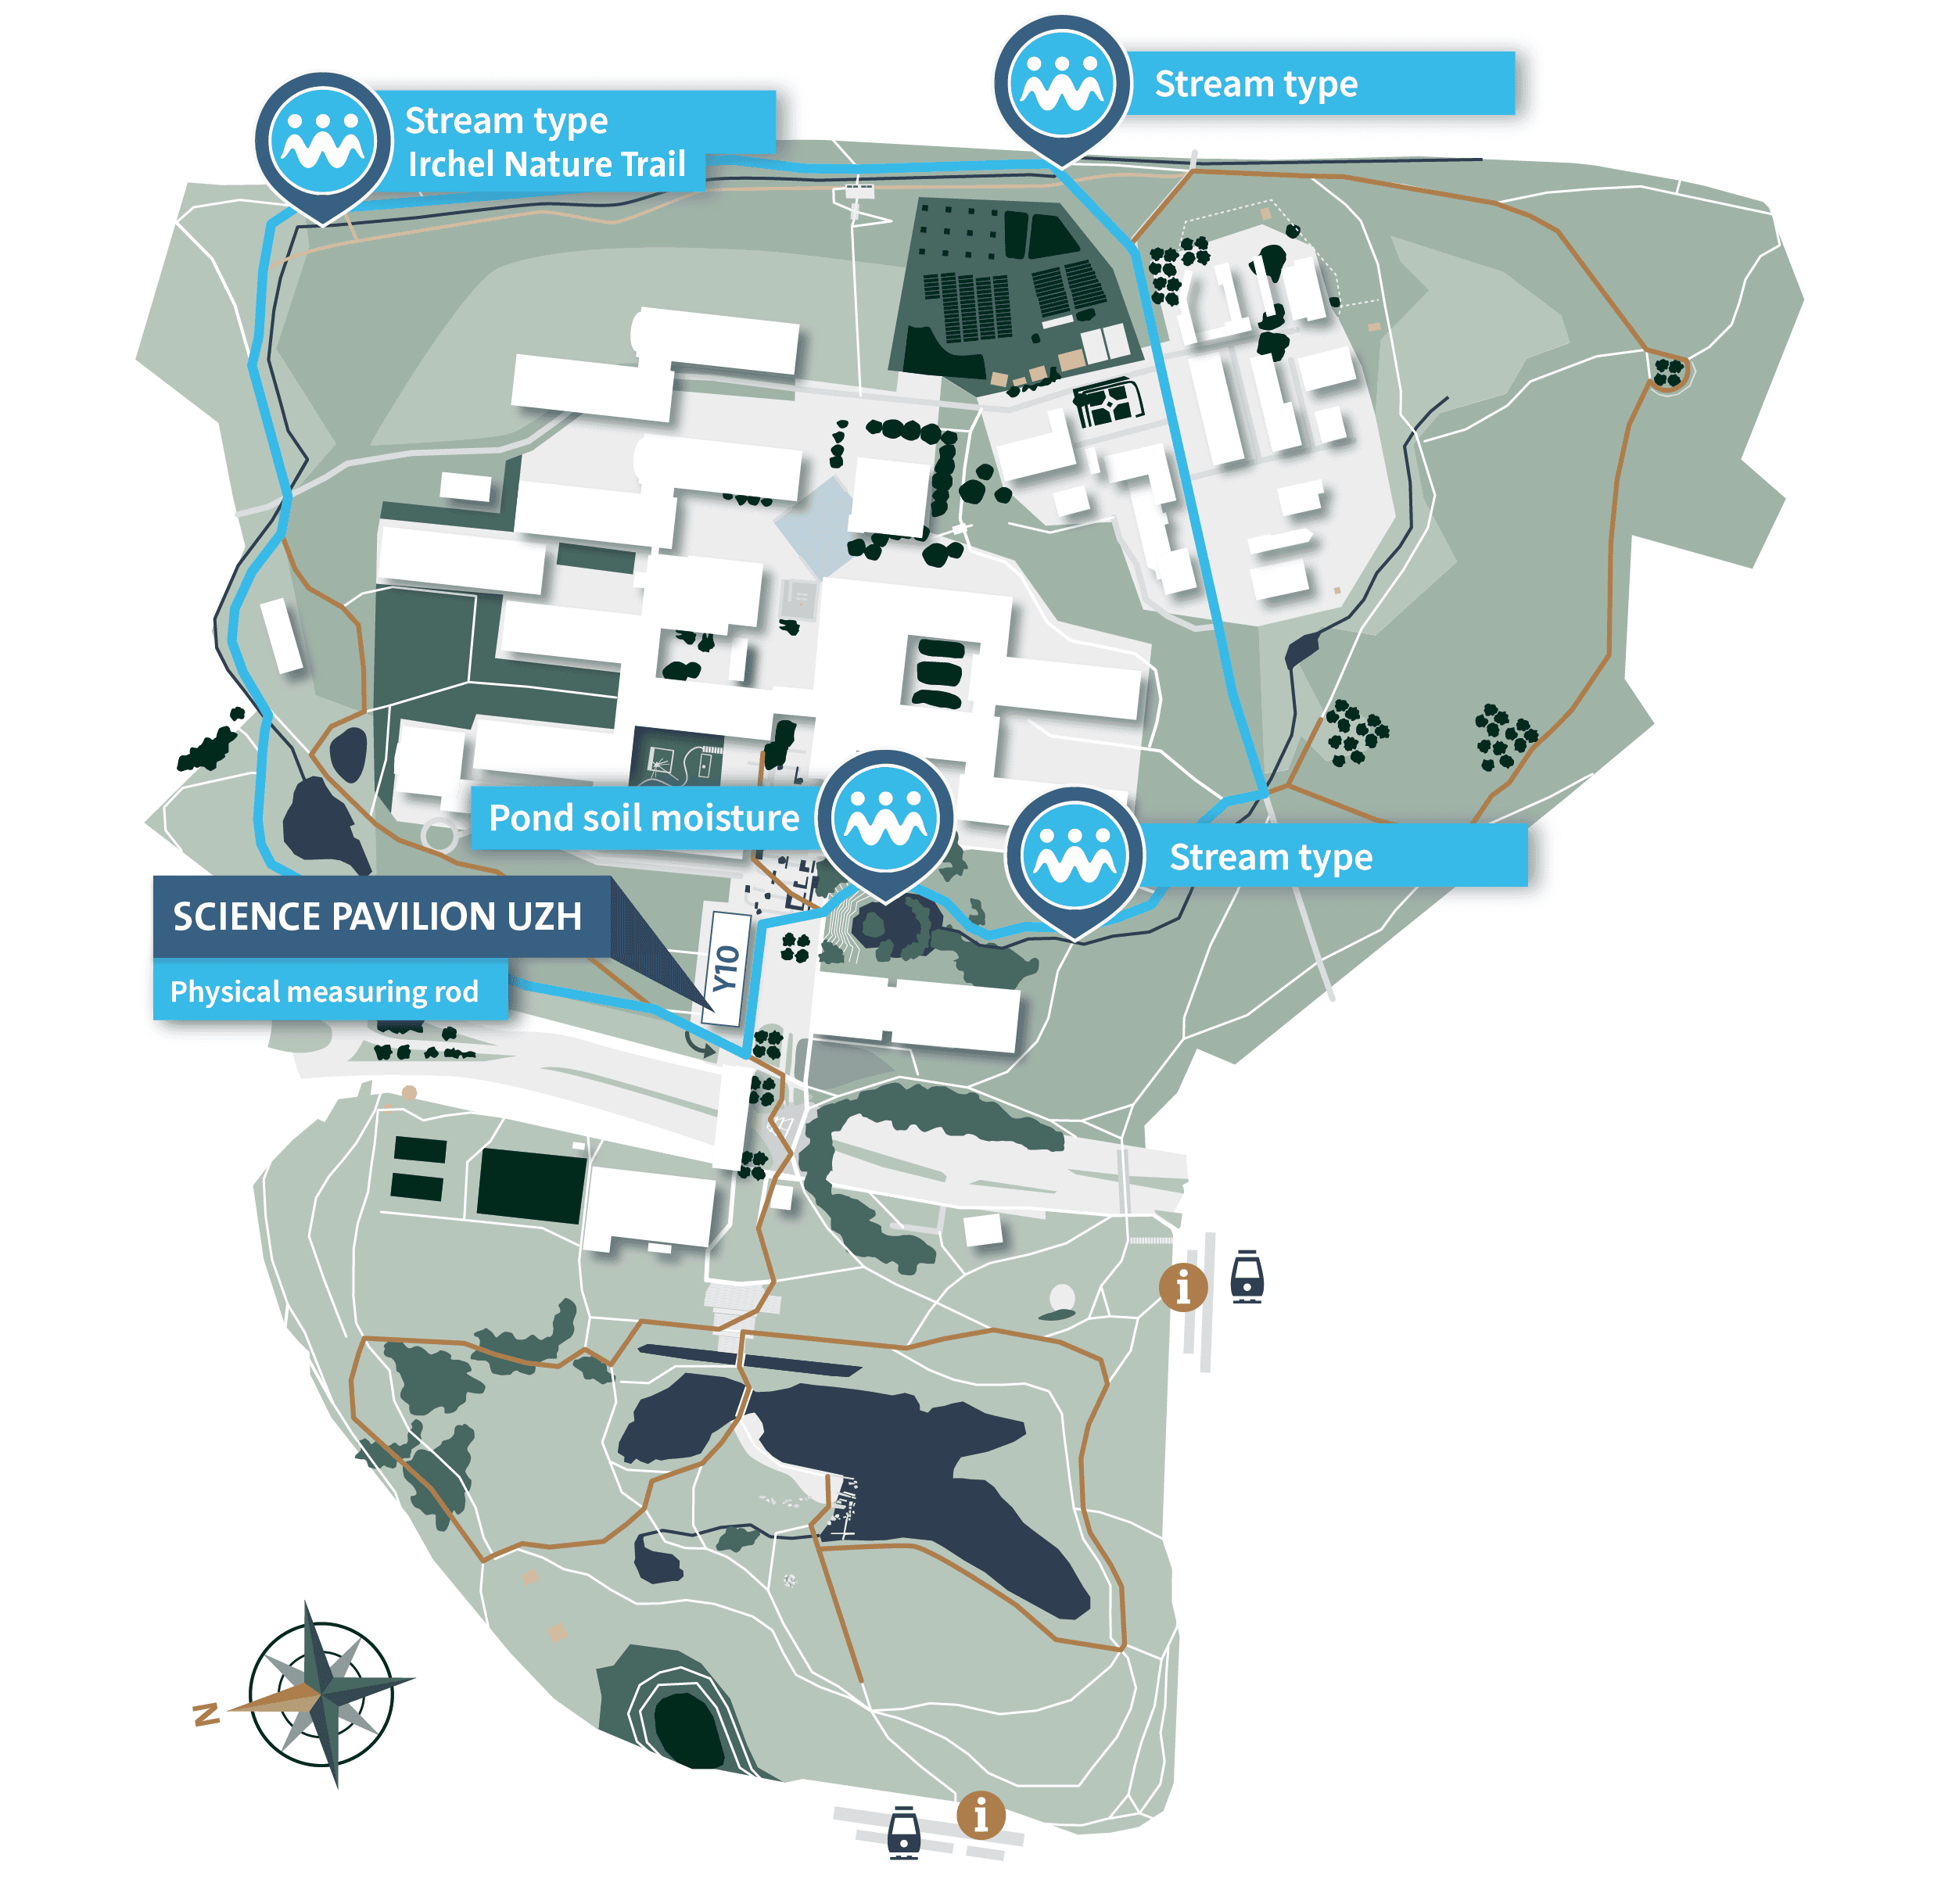
You will find spots from different categories on the campus. For example, there is a soil moisture spot at the pond just in front of the Science Pavilion UZH, and a little further up along the stream, two spots from the category „temporary stream“. You can also see the spots on the map called "CrowdWater locations Campus Irchel".
-
Touch the spot where you wish to add a measurement. Go out and find the spot by orientating yourself on the pictures in the app. They show you precisely where the spot is located.
-
In the middle of the screen you will find a white plus on a blue background. Tapp it.
-
Using the camera button, you can now add a photo of the measurement point.
-
You can now take a new measurement: Depending on the category, you assess how wet the soil is or in what condition the temporary stream is. Tap on the appropriate button.
-
Do not forget to save the spot at the end.
THANKS FOR YOUR FIRST OBSERVATION!
Many more CrowdWater spots are waiting for you. Have fun collecting the data!
Playful: With the CrowdWater game
The citizen scientists compare an updated image with the corresponding reference image in the game and estimate the water level class. Since the average of many people’s observations is often more correct than individual observations, the actual water level class can be confirmed. This allows errors in the collected time series to be corrected. Every month there are many great prizes to win in the CrowdWater game. Join in! You can find all the information under the QR code below.


- QR-Code: cwgame.spotteron.net/championship
The researchers
Research is teamwork – also in hydrology
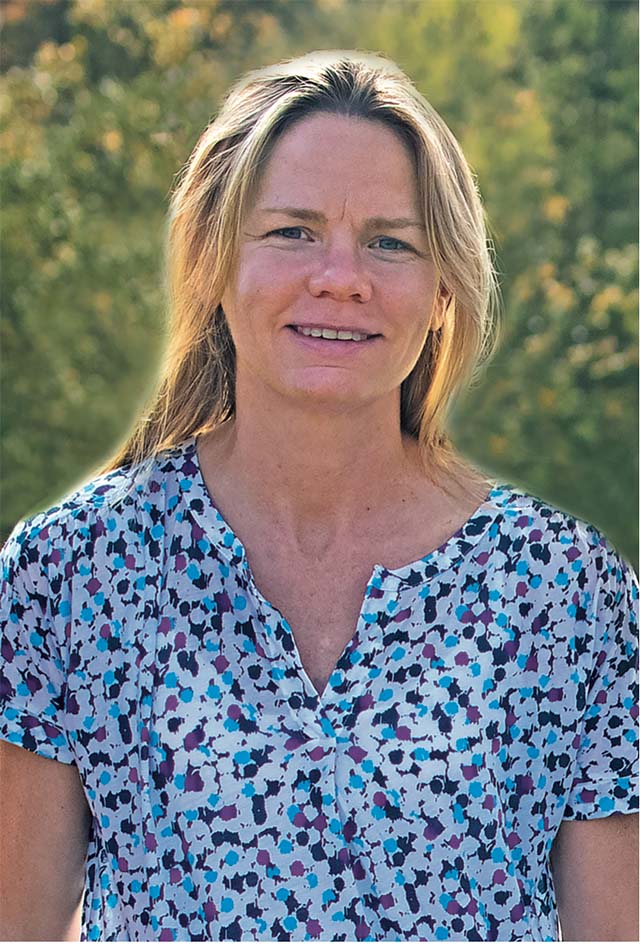
CrowdWater is directed by Prof. Jan Seibert and Dr Ilja van Meerveld. Both work in the Hydrology & Climate group at the Institute of Geography of the UZH. The project is financed by the Swiss National Science Foundation (SNSF) for the promotion of scientific research.
-

- Zoom
- CrowdWater Project group foto
CrowdWater continues to develop – locally and globally
The methodology of CrowdWater, and especially the app, is continuously improved and extended. Current inquiries in CrowdWater deal with the dynamics of temporary streams and water quality. Data is being collected by citizen scientists all over the world. At UZH most of the CrowdWater observations are focused on Switzerland. Still, CrowdWater is also used globally: In Chile, for example, a group of indigenous Mapuche is using the CrowdWater app to collect data on the river that is their lifeline. Kyrgyz researchers collect water level data with CrowdWater, and thus create a data basis for their country. Even in the European neighbourhood, CrowdWater is used extensively: In the Netherlands, beginning in Leiden, a movement started using CrowdWater to observe the plastic pollution in the canals of various cities.

Portrait video Prof. Jan Seibert
Project outlook
Locally and globally
CrowdWater is continuously being developed
The methodology of CrowdWater, and especially the app, is continuously improved and extended. Current inquiries in CrowdWater deal with the dynamics of temporary streams and water quality. Data is being collected by citizen scientists all over the world. At UZH most of the CrowdWater observations are focused on Switzerland. Still, CrowdWater is also used globally: In Chile, for example, a group of indigenous Mapuche is using the CrowdWater app to collect data on the river that is their lifeline. Kyrgyz researchers collect water level data with CrowdWater, and thus create a data basis for their country. Even in the European neighbourhood, CrowdWater is used extensively: In the Netherlands, beginning in Leiden, a movement started using CrowdWater to observe the plastic pollution in the canals of various cities.